Iris Classification
The iris dataset is a classic in machine learning and statistics — 150 samples of iris flowers, each with four features: sepal length, sepal width, petal length, and petal width. The goal is to predict a flower's species (setosa, versicolor, virginica) from its features. I implemented two classifiers — k-means clustering and a neural network — and evaluated both across a set of experiments.
K-Means Clustering
I implemented a simple k-means with a constant seed so the random generator gives repeatable results. It picks k "random" sample means, assigns each flower to its closest mean, then updates the means and repeats until convergence (previous means = current means).
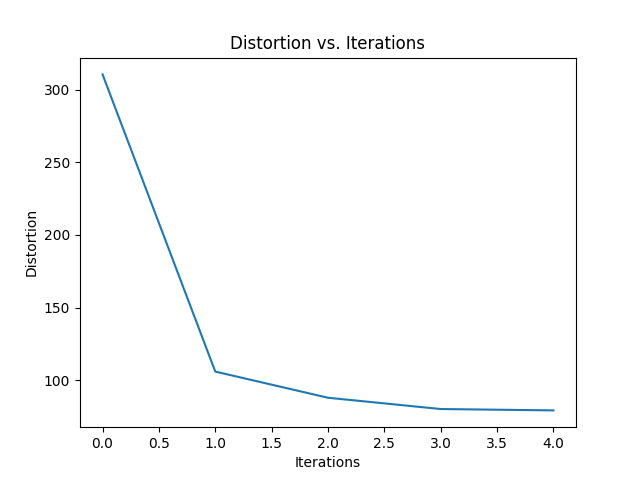
Shown is a plot of distortion vs. iterations — the overall distortion of all clusters measured over time.
To visualize k-means running, below are the initial means, an intermediate clustering, and the final converged means for k = 2.
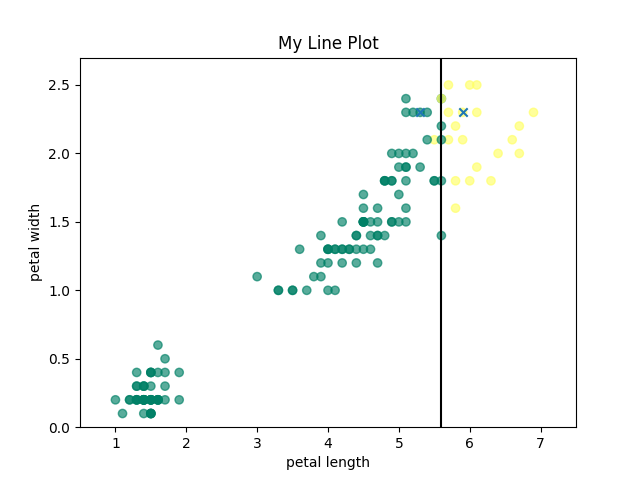
Initial means
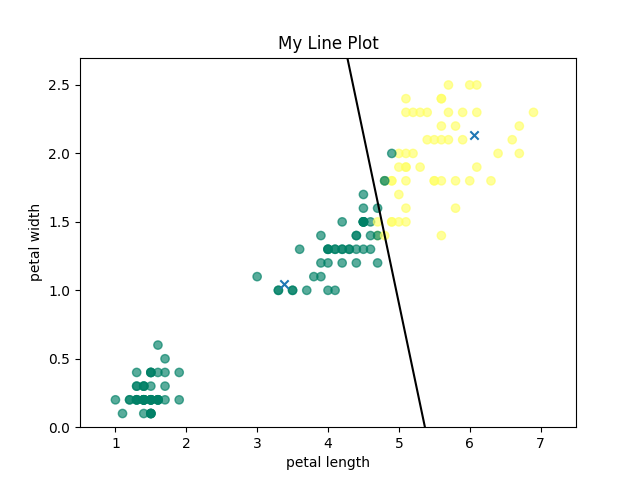
Intermediate clustering
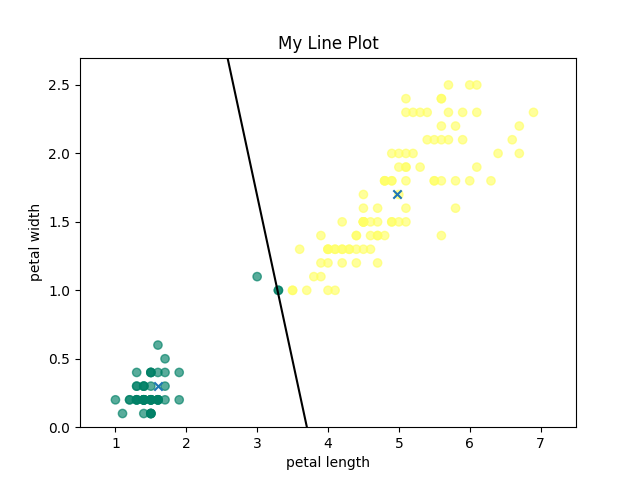
Final converged means
Neural Network
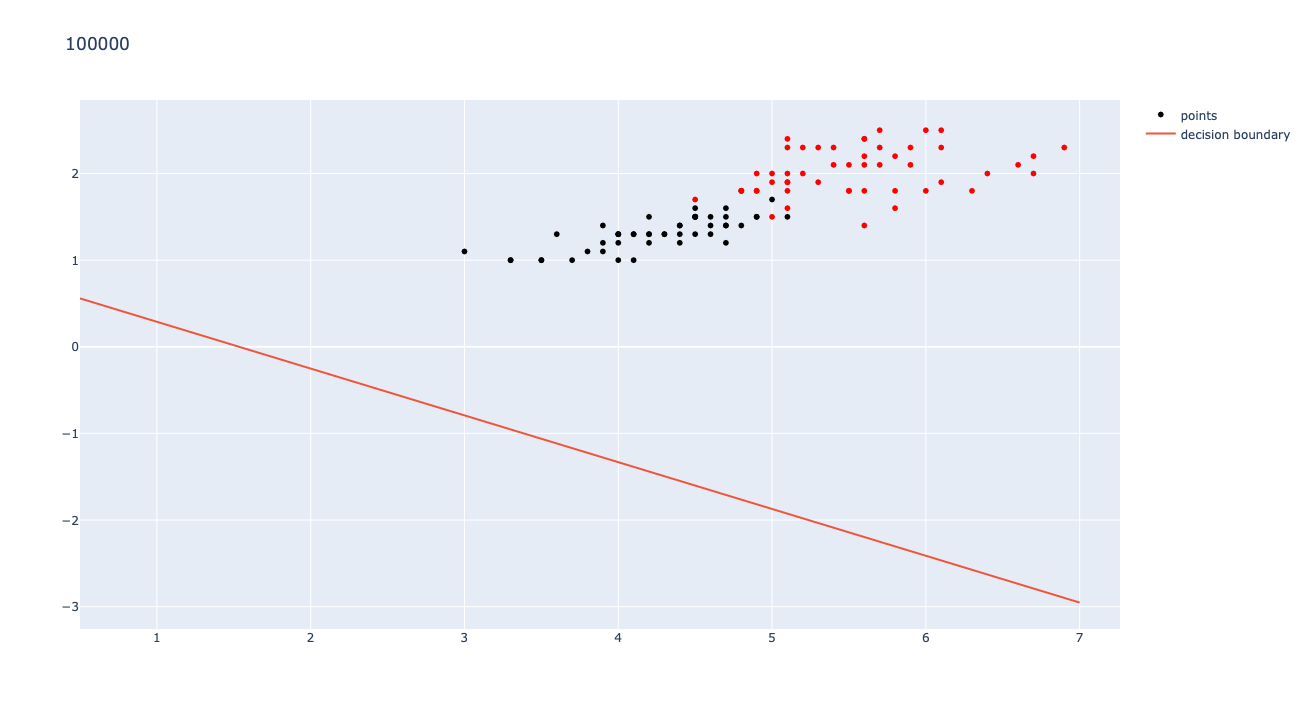
For the network I switched to NumPy arrays for more flexibility and used Plotly instead of Matplotlib. Training runs on MSE, which computes mean squared error via my prediction function combined with a sigmoid activation; a plot_boundary function then draws a decision boundary between clusters 2 and 3. MSE takes the data vectors, the network parameters (w, b), and the pattern classes.
The network's output looks less tidy — easily explained: it classifies on all four variables (petal length/width, sepal length/width), but the graph only plots petal length and width. K-means also uses all four, but the network weights them far more accurately.
I started with weights [.1, −.1, .1, .1] and bias −.7, and ran 100,000 iterations at a learning rate of .0001. The first three iterations are shown below.
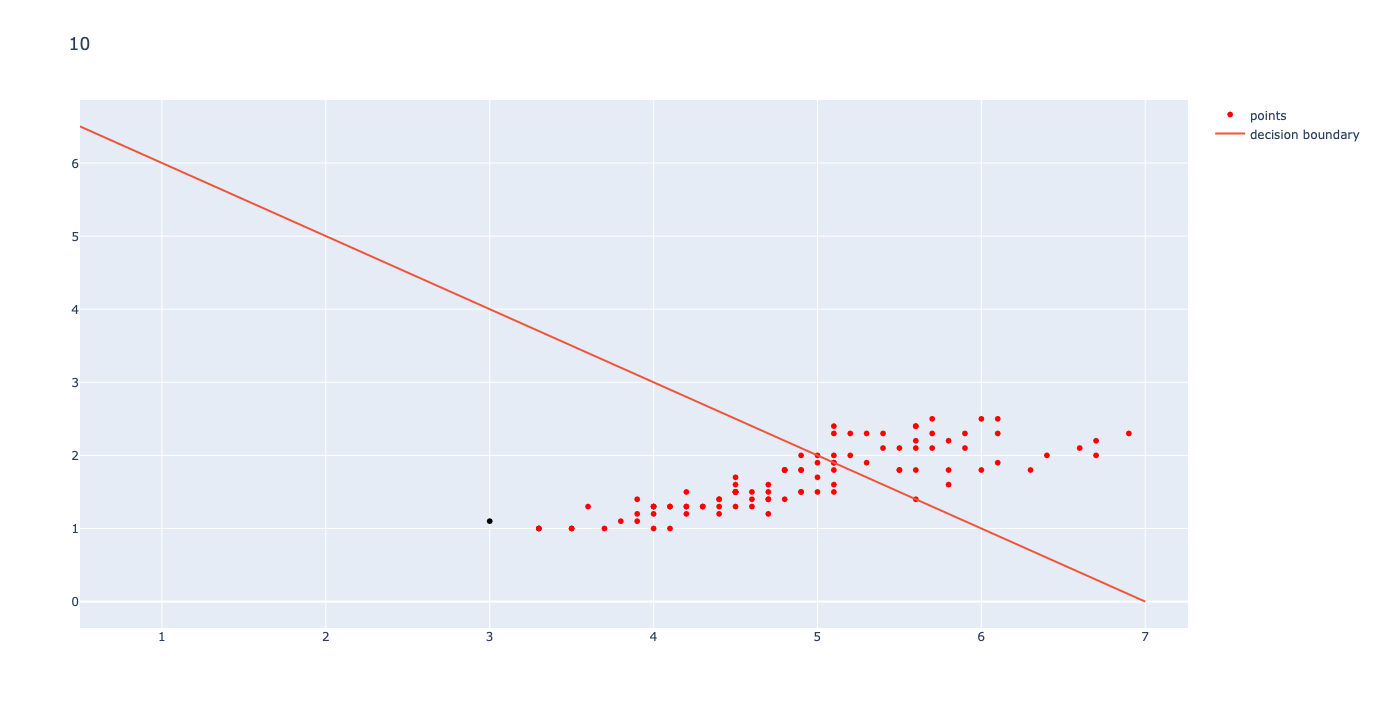
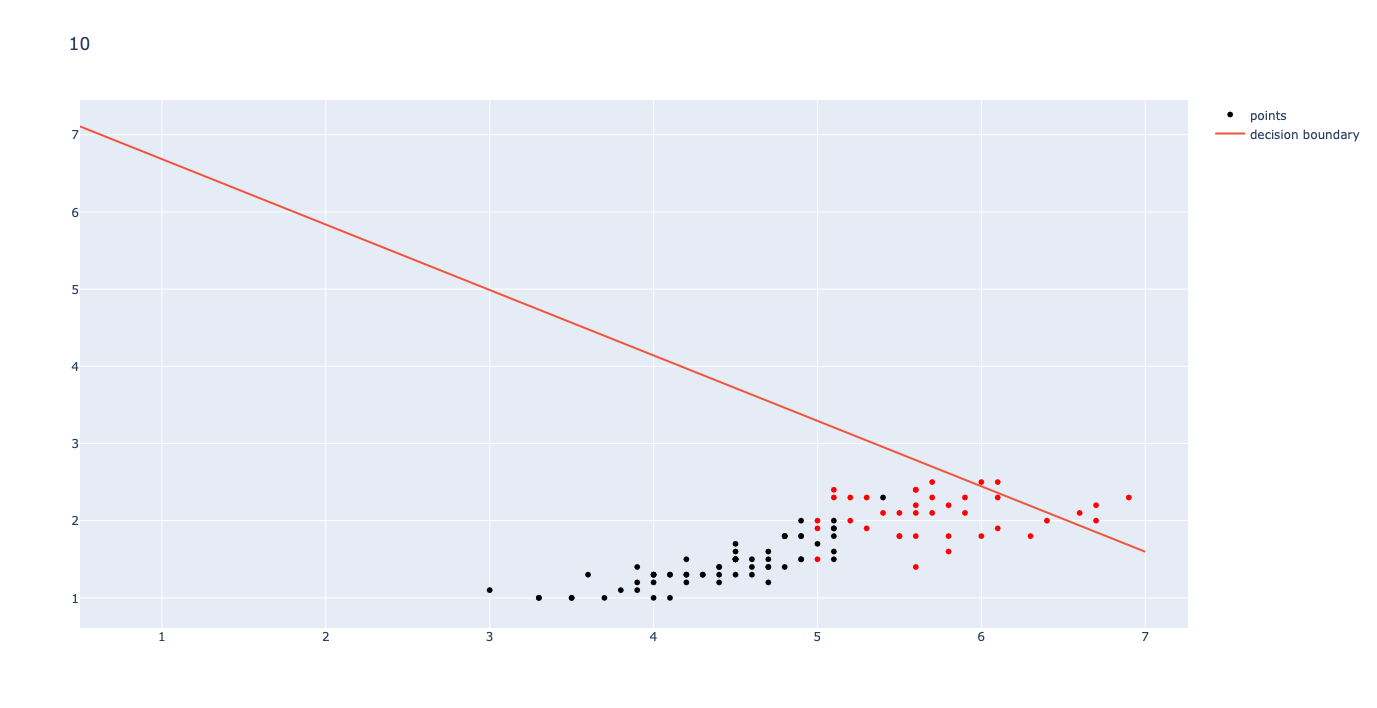
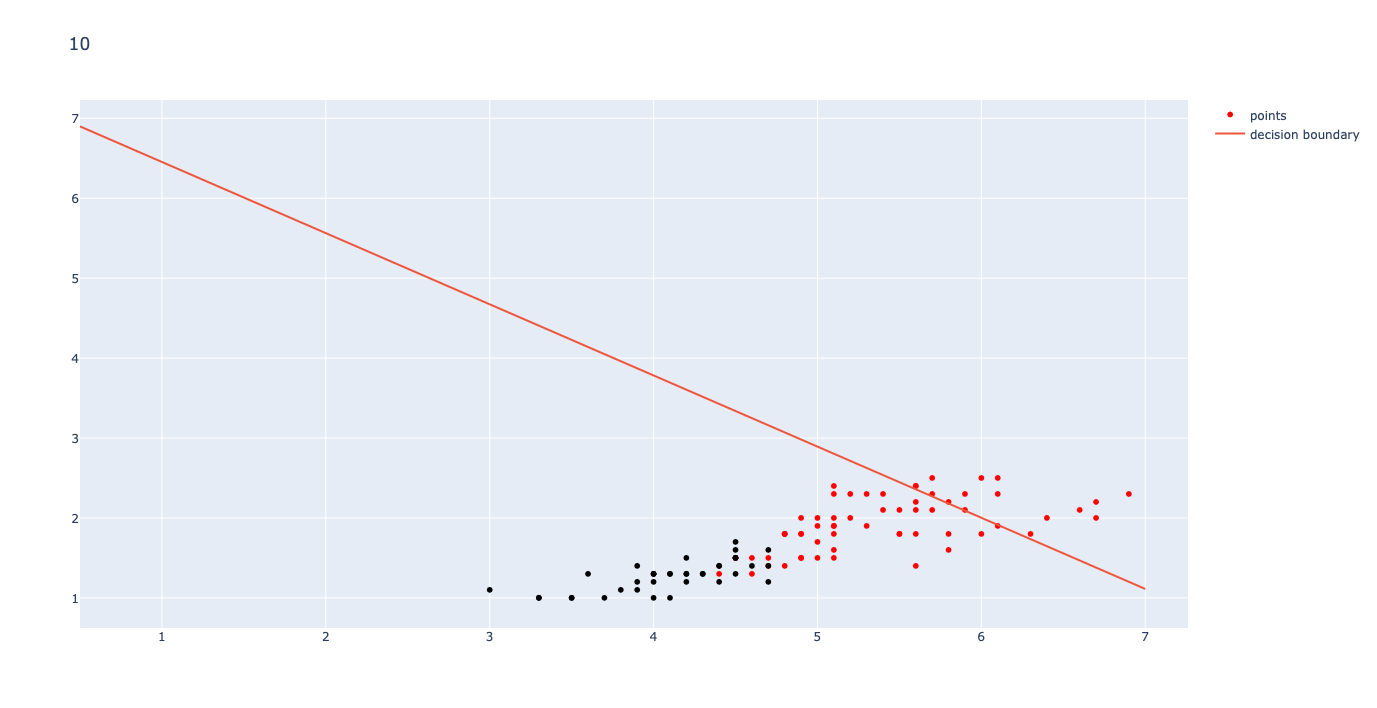
As the graphs show, learning at a small step size still changes noticeably early on, but the changes become barely perceptible as the loop nears completion. It works best with a low step size (.0001) and many iterations. After 100,000 iterations at step size .0001, the MSE converges to 0.028491. The final result: